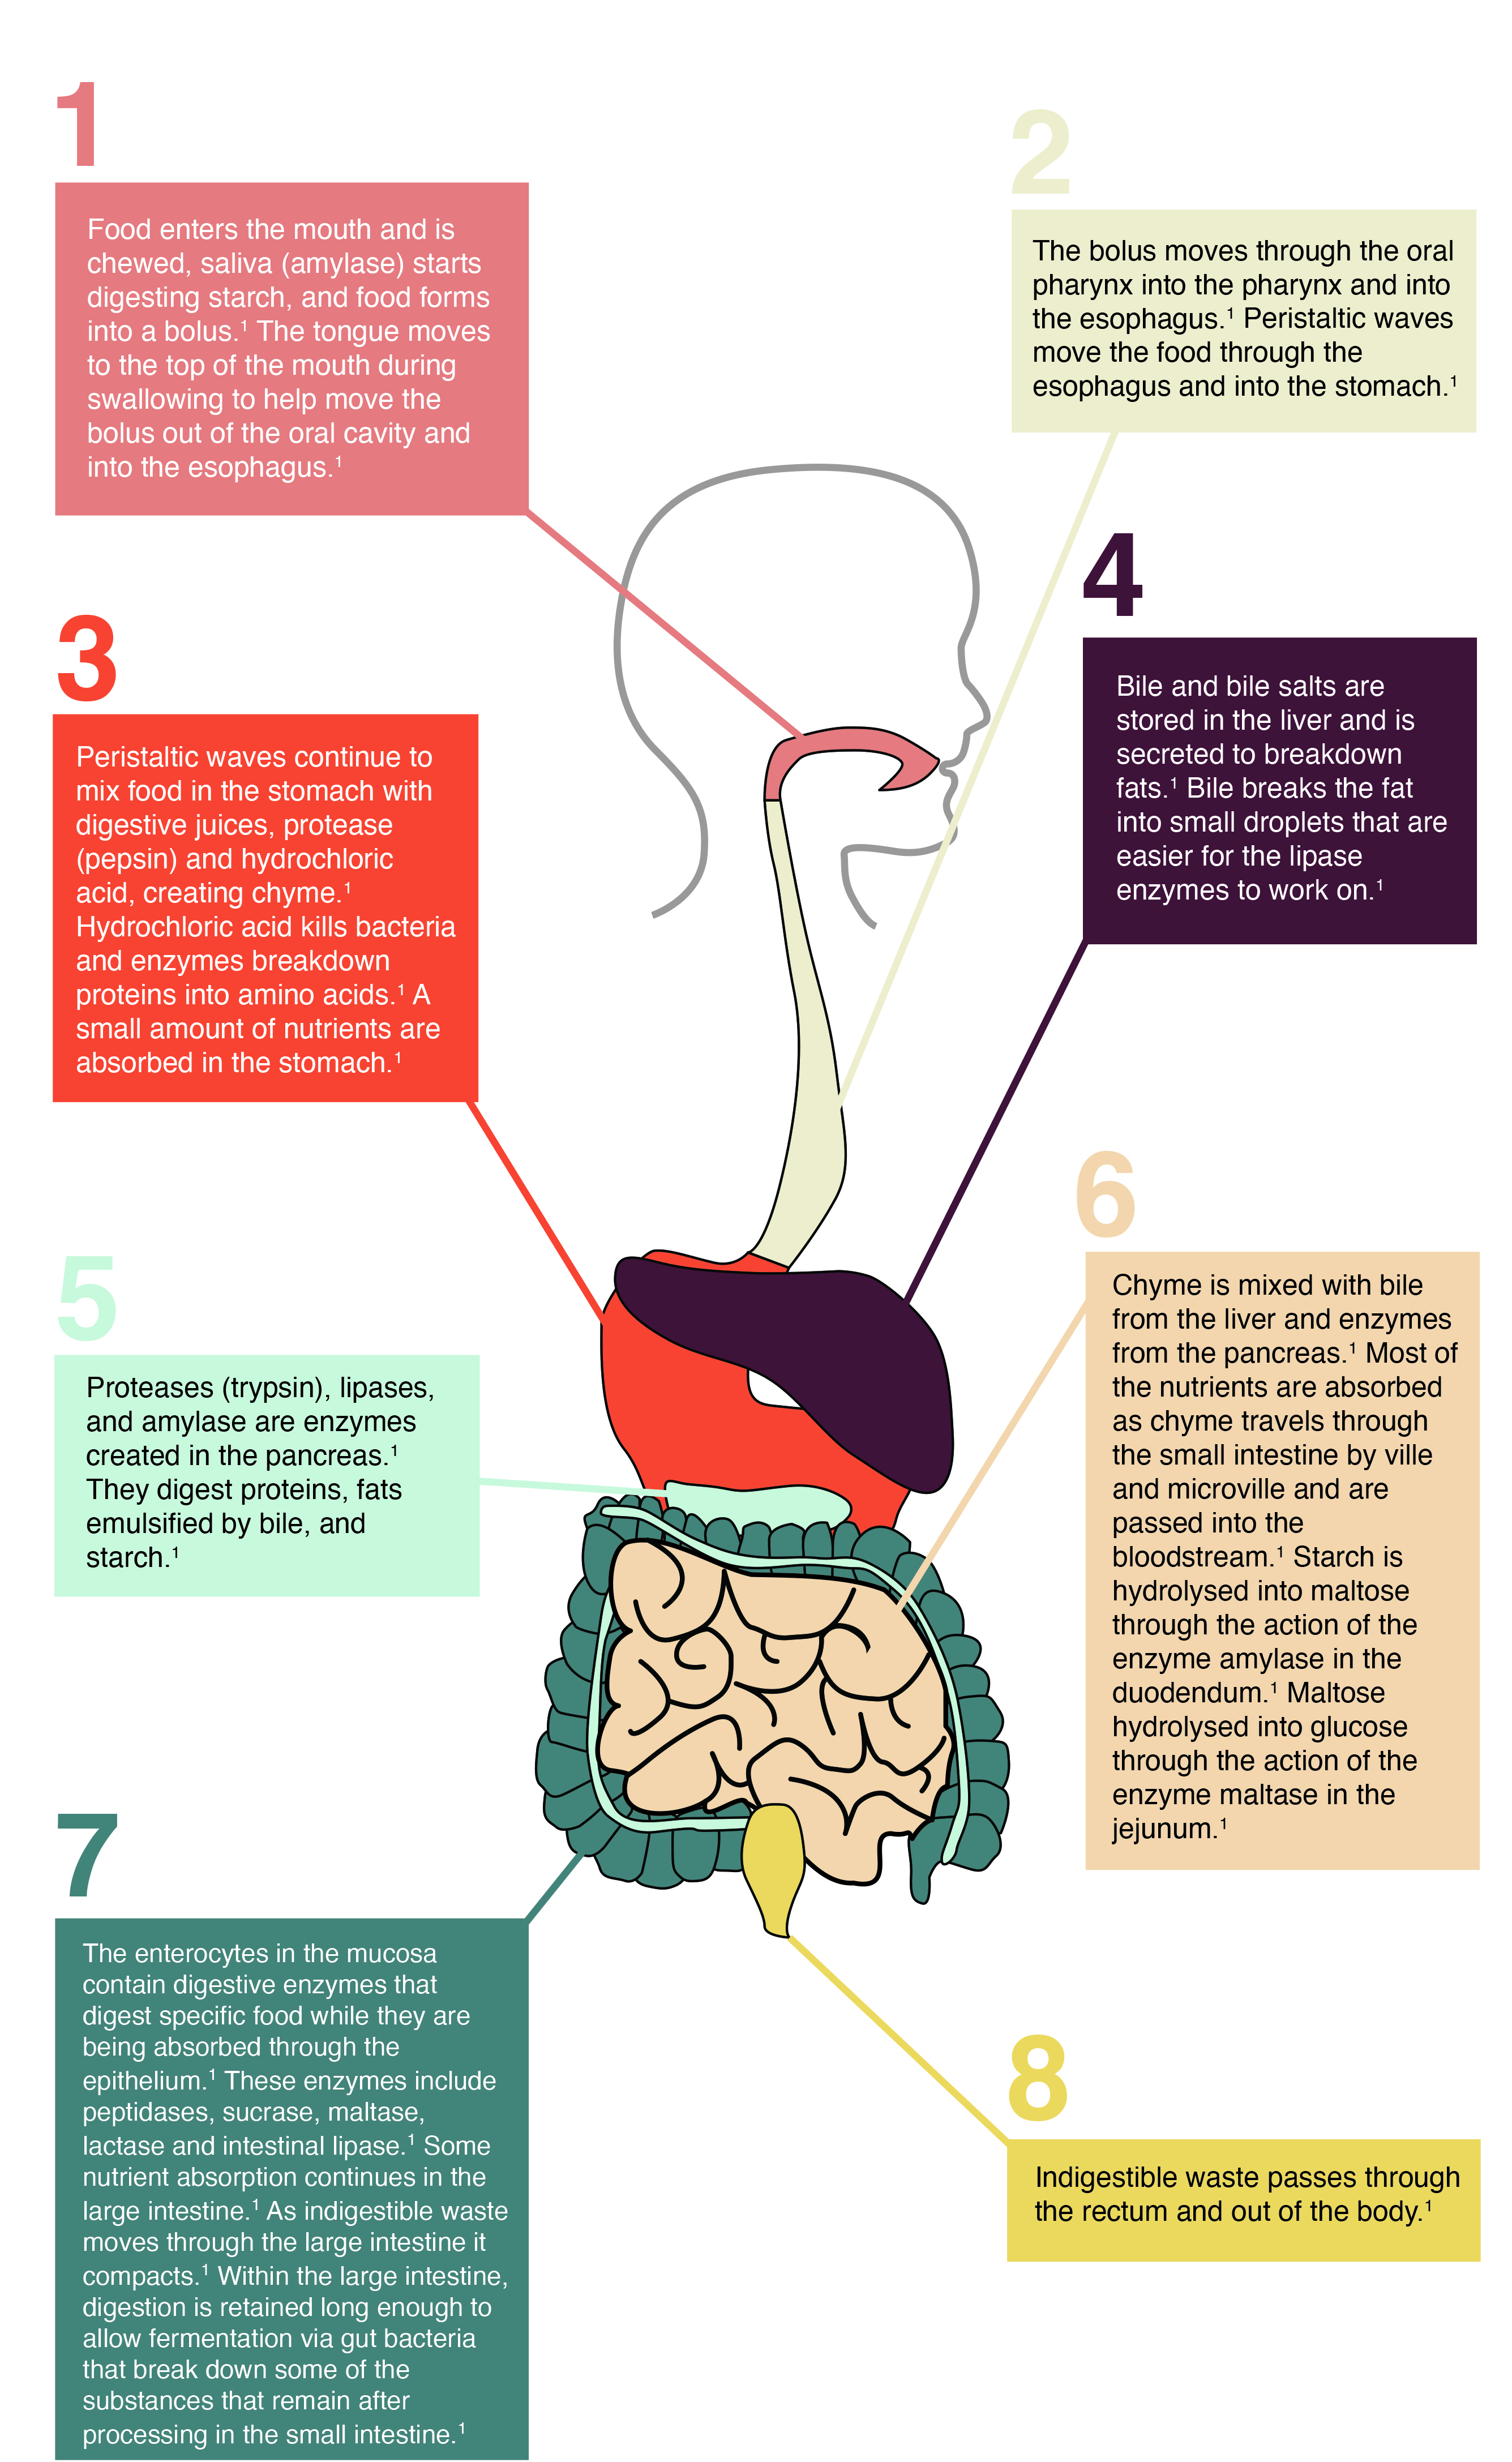
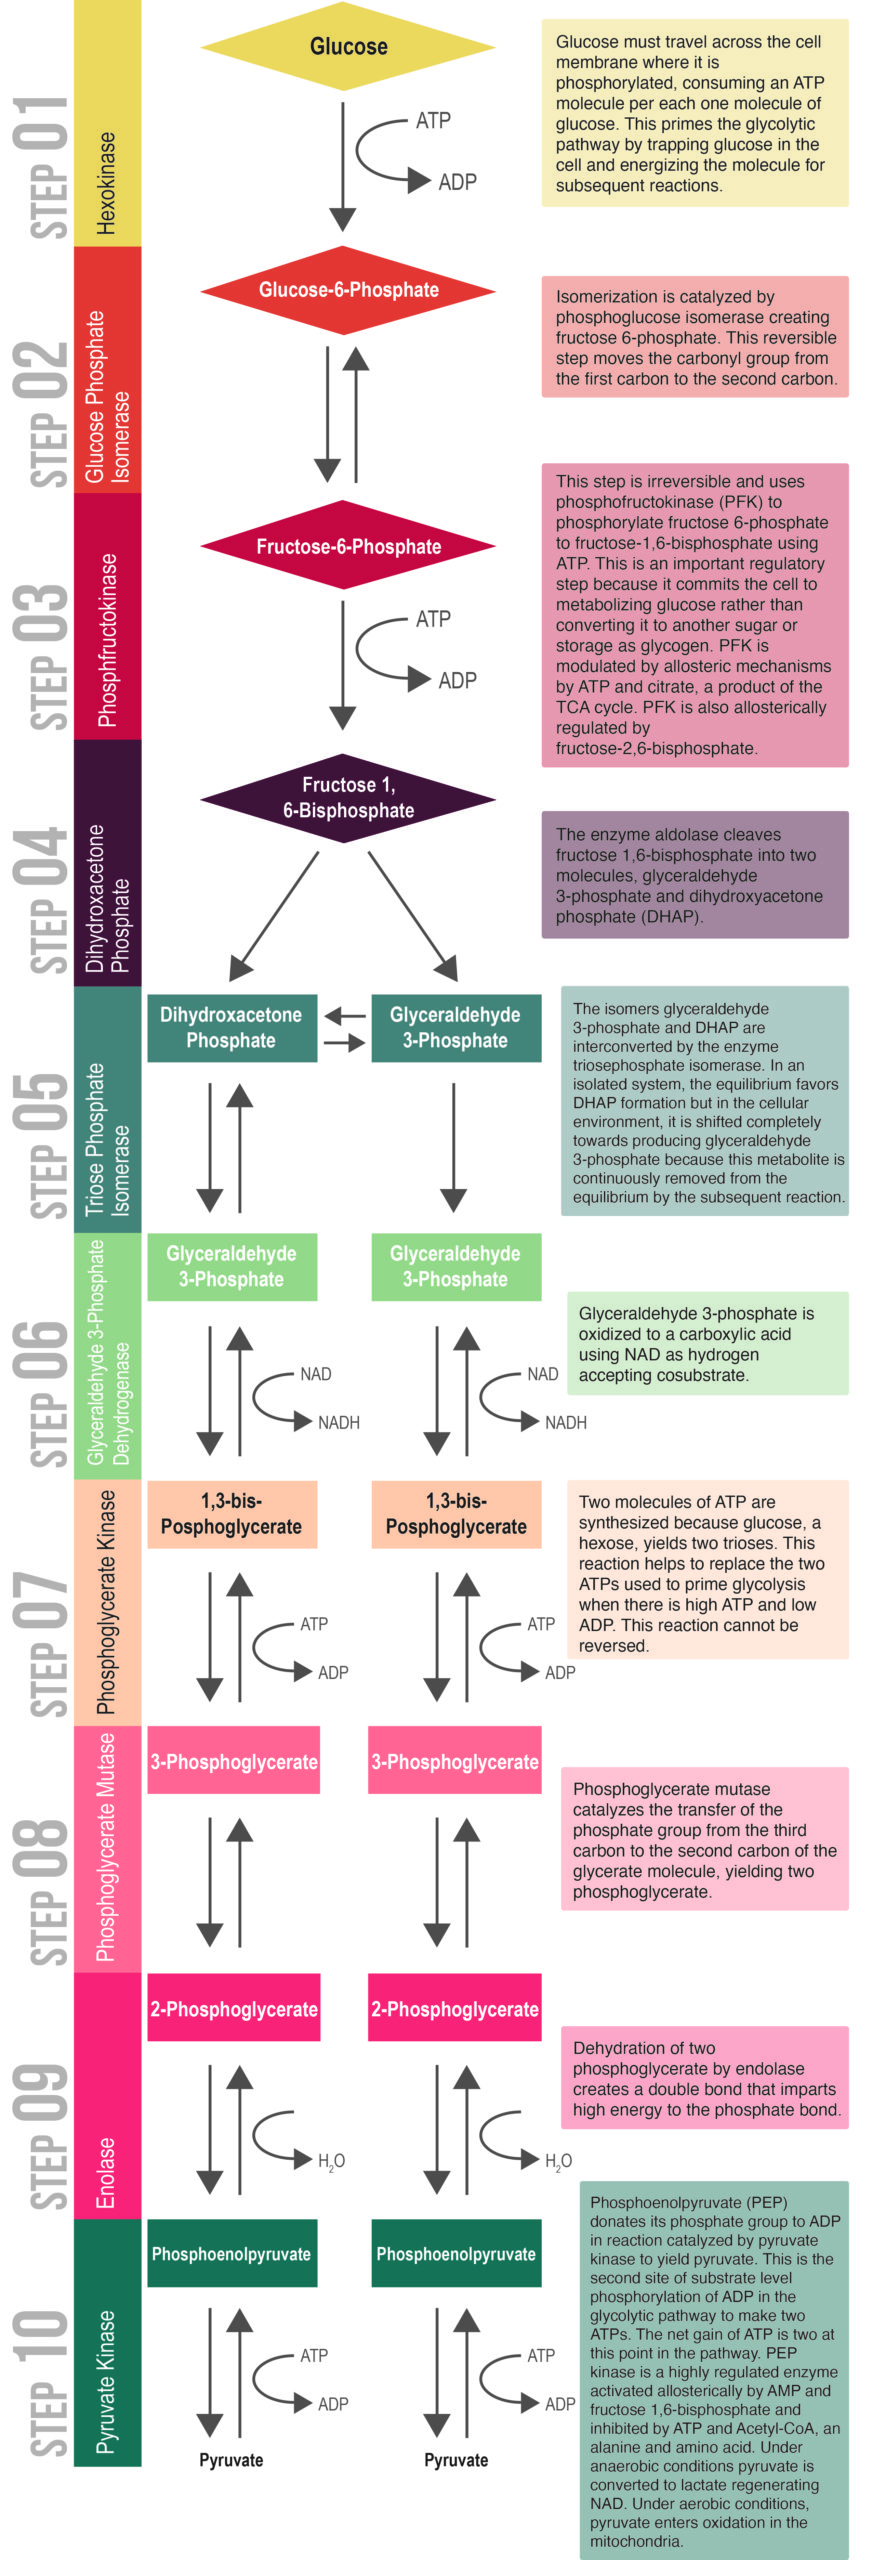
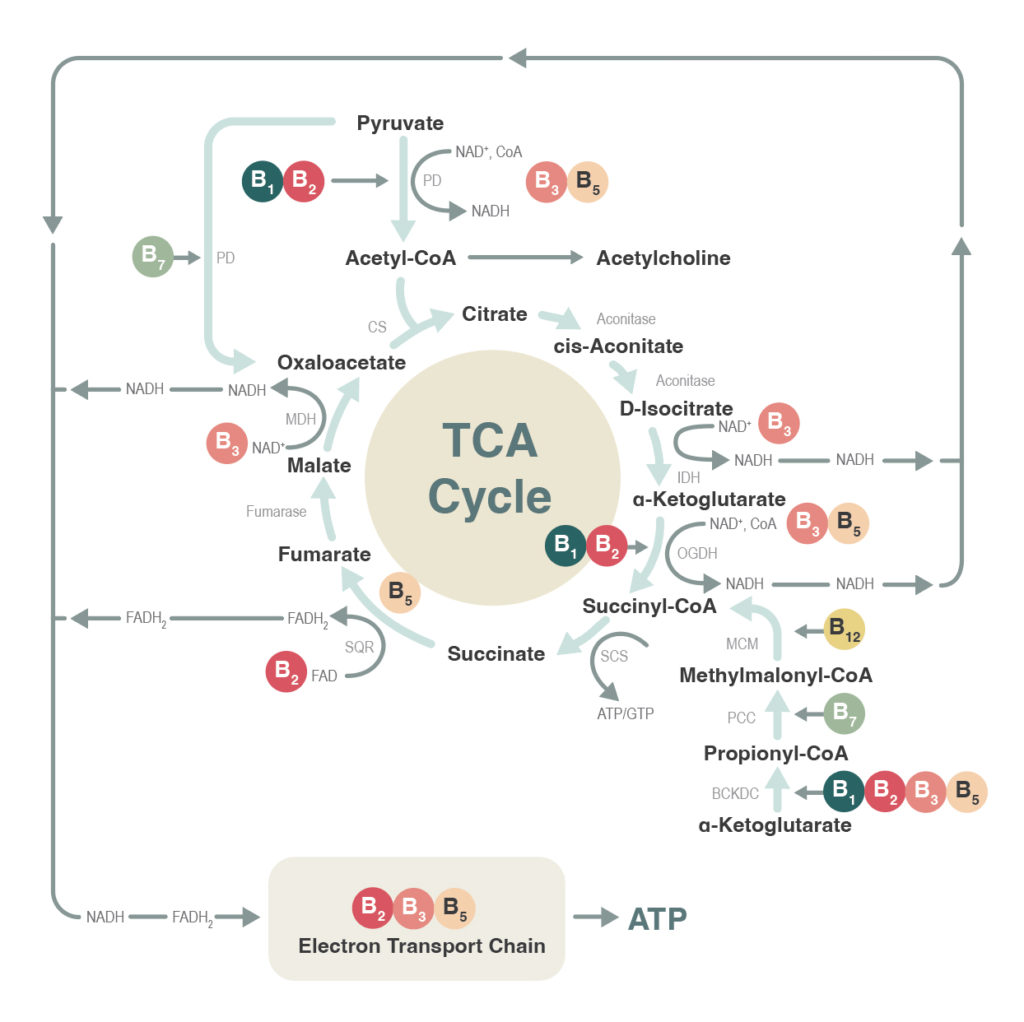
I designed infographics to visually represent the biochemical processes of digestion, glycolysis, and the TCA cycle. By strategically utilizing typography and color, I simplified complex scientific concepts into clear, engaging graphics that were both informative and visually appealing.
Medical Infographics
Presentation Infographics
Infographics were created for a client presentation to illustrate data in a visually appealing format.


Scope Infographics
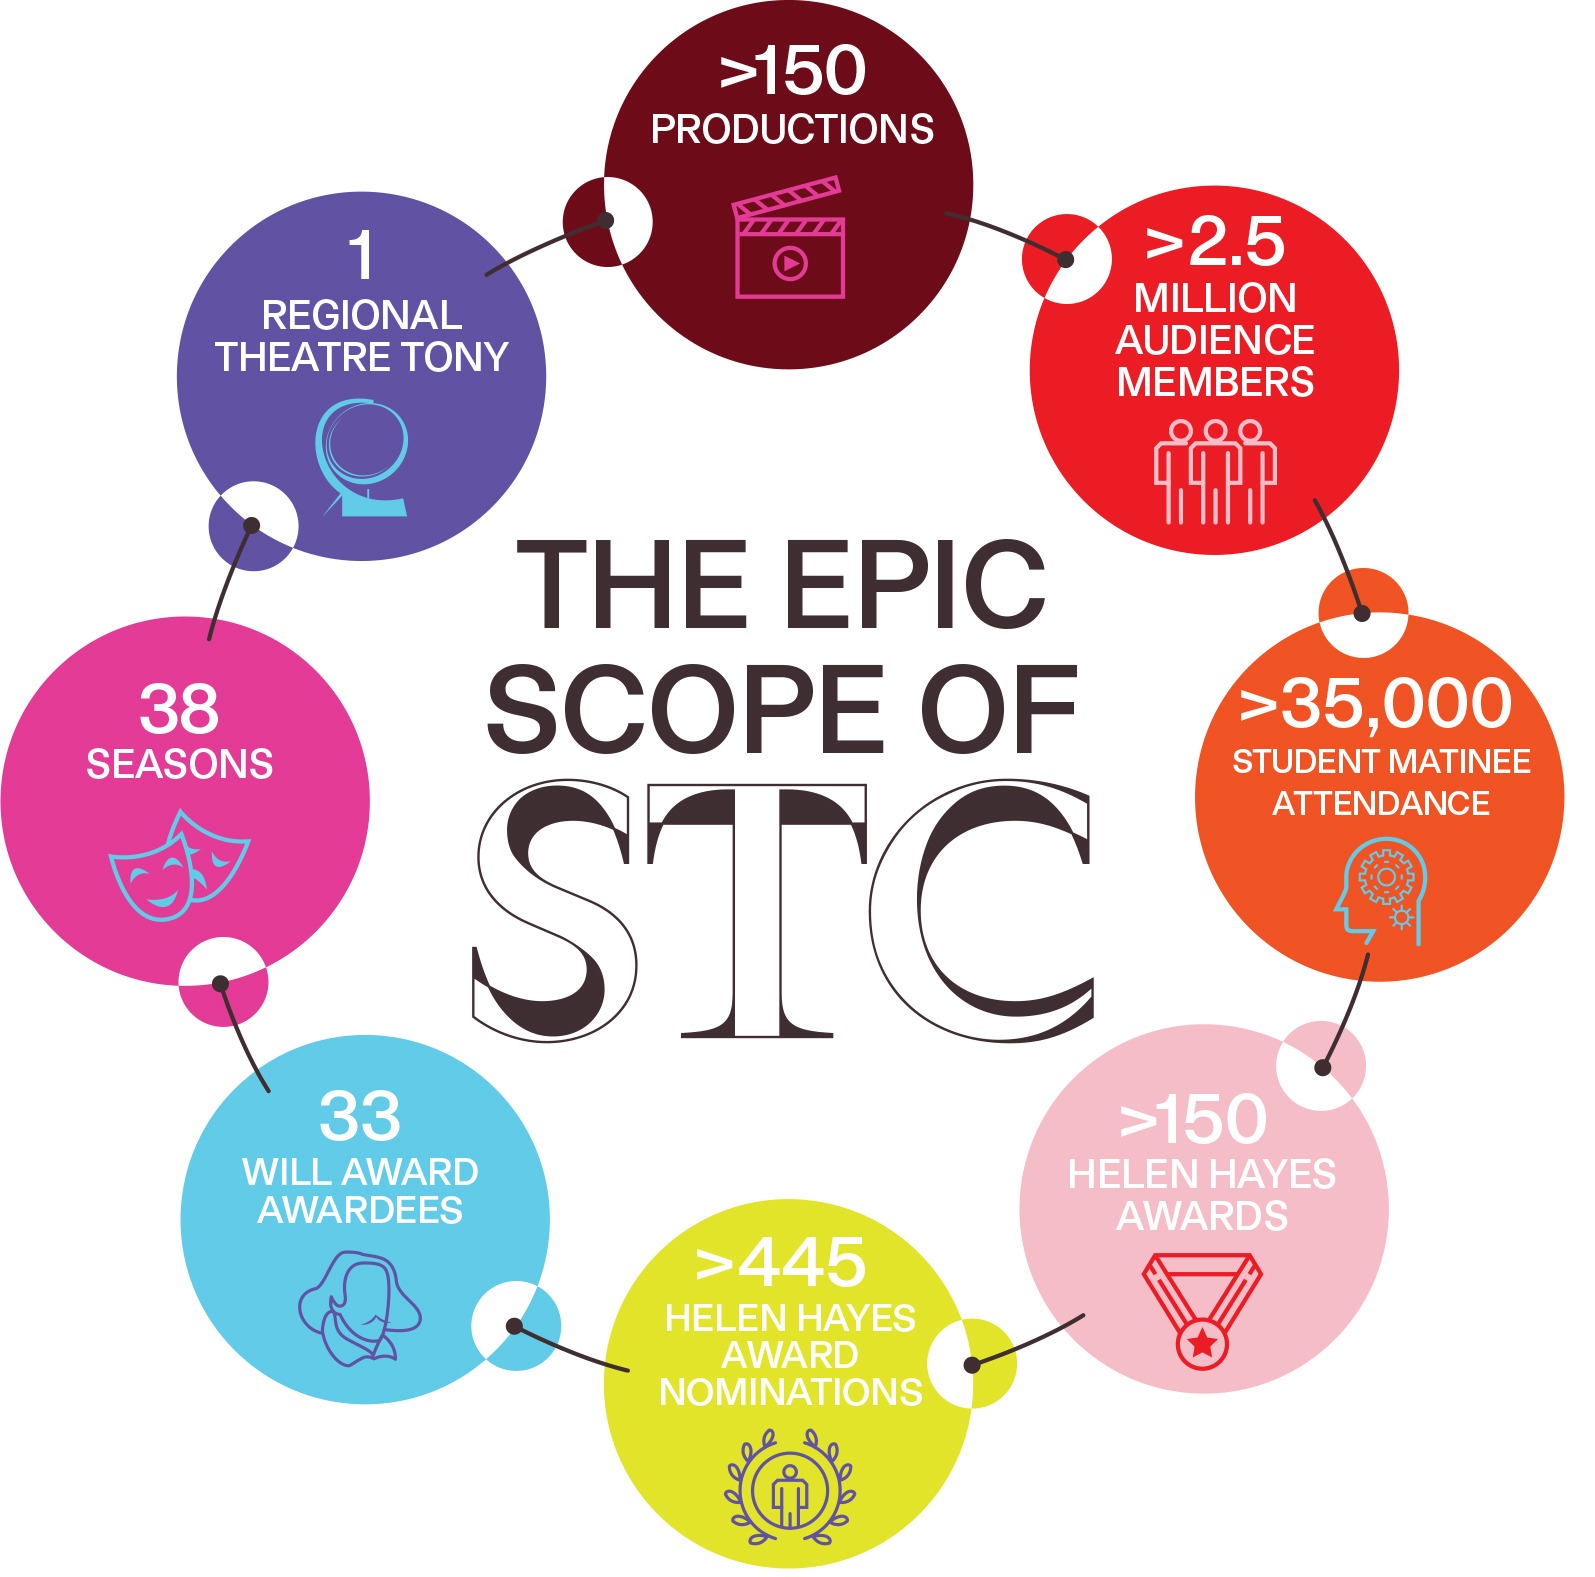
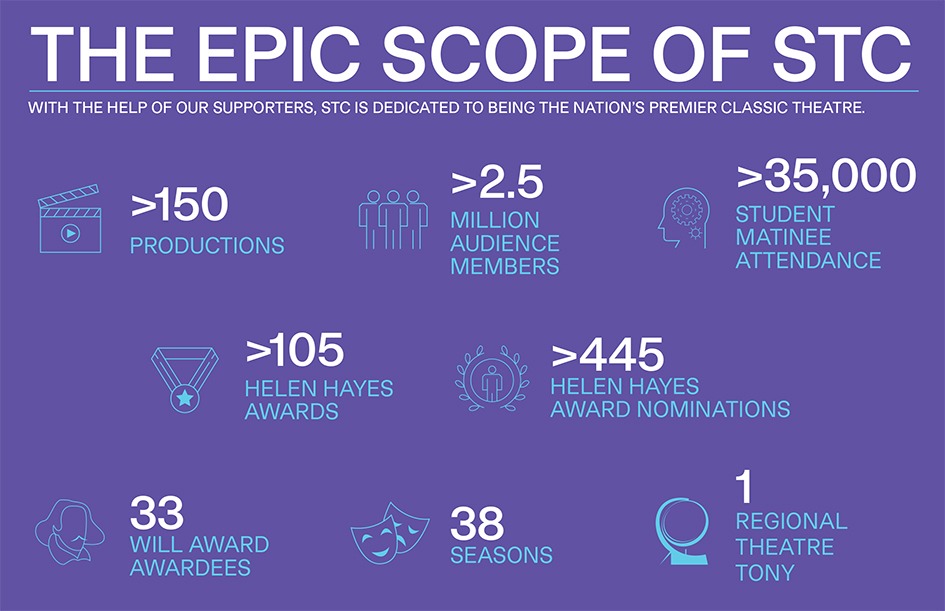
Infographics created for the Shakespeare Theatre Company to highlight the breadth of the theatre’s achievements for both current and prospective donors.